


You are the Reason for the
Safety Video
1. What is lacrosse?
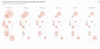
2. What do you notice about this graph?
3. What larger patterns do you notice?
4. What do you wonder about the shift in injury data from one sport to another?
5. Is the number of high school boys being injured high or low?
6. Look up the protective gear that the players wear for each sport. What do you notice about the relationship between the protective gear in the sport and the type of injuries the boys are having?
7. Looking at the graph, what are three changes you would make to any of the sports equipment to see some positive differences in the next graph?
8. If each of the injuries were to represent a single game how many games were played of each sport according to the graph? Write it in standard form, and exponential form.
9. If each of the injuries were to represent a single game, how many overall games are represented on the graph?
Write it in standard form. Write it in exponential form.
Football Exponential Form Standard Form
Hockey Exponential Form Standard Form
Wrestling Exponential Form Standard Form
Lacrosse Exponential Form Standard Form
Soccer Exponential Form Standard Form
Basketball Exponential Form Standard Form